The mysterious case of the failing AWS Elastic Beanstalk instance
Lots can go wrong when you run out of CPU Credits. A cautious tale about calculating and determining the right AWS EC2 instance type
By Ronny Shani | Contributing editors: Lucas Hild, Merlin Carter
Our story begins in the early evening of December 5, 2021. Apart from the fact that two hippos at the Antwerp zoo in Belgium tested positive for Covid-19, nothing extraordinary happened that day.
For us, it was anything but. That’s when we started experiencing sporadic high latencies on one of our AWS Elastic Beanstalk instances. Exciting, right?
But let’s back up a bit and properly introduce ourselves. “We” is Knowunity, Europe’s first E-learning platform, where students can view and download school materials: From summaries to presentations and flashcards for various subjects. The platform also functions as an online tutoring community where people can interact in real-time, share content, and support each other. Since our launch in September 2020, Knowunity quickly became Germany’s leading education app and is now active in four countries — Germany, Switzerland, Austria, and France — serving around 2 million students.
Go AWS
We host our Go backend on AWS Elastic Beanstalk and have 10 T-series instances behind a load balancer. Our Go app serves our public API, which feeds into our mobile apps and website.
Fast forward to those long winter days before Christmas. One instance starts to choke in the evening — weekends and weekdays. The issue went away during the Christmas holiday, just to come back to haunt us shortly after school resumed in the second week of January.
Our monitoring systems alerted us about the high latencies, but we had to figure out the root cause.
That meant we had a few minutes to assess what was going on before terminating the failing instance to ensure our service ran without significant performance issues.
We started by mapping out what we know: The issue has occurred nine times so far, always in the evenings but only on one machine. We’re running the same application version on all ten instances, and they all handle the same workload.
Line up the suspects
Our backend typically handles between 100 r/s and 250 r/s, and we recorded a request rate of around 180 r/s during the incidents. Not exceptionally high — we can check traffic spikes off the list.
Restarting it doesn’t help either — it quickly relapses, indicating that it’s also not a memory leak in the application itself.
Next, response time. 9 out of the 10 instances retain our average response time of 65–75 milliseconds. One lagged way behind, at 6 seconds on average, with AWS Session Manager indicating the application takes up around 90% of CPU compared with 10% CPU on other machines. This Eureka moment was short-lived: We inspected the metrics only to find that the total CPU usage of this instance shows nothing unusual.
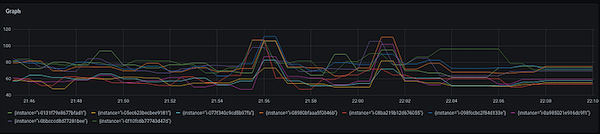
Average response time of the rest of the instances (2021–12–14) Hiding the concerned machine to demonstrate others don’t experience high latency
We don’t run CPU-intensive queries, and most glitches we had before were related to our database, which led to our next suspect. We noticed that the connections to our RDS instance (running Aurora PostgreSQL) spiked intensively. But we hit another dead end: the graphs showed that the latency increased on one of the instances — not all of them.
We faced a dilemma that interrupted our investigation: While we managed to identify the victim, we couldn’t pinpoint the culprit during the small window of opportunity we had to analyze the situation. Luckily, most of our users weren’t affected by the issue, but we risk hurting them if we let this instance keep running. That meant we had a few minutes to assess what was going on before terminating the failing instance to ensure our service ran without significant performance issues.
All for one
We finally turned to CloudWatch. We terminated the problematic instance and took a deeper look at all the metrics. We found an intriguing factor: CPU Credits. It turned out they were stable throughout the day, but when many students logged in after school, the CPU Credits quickly dried up. You see, we have a relatively predictable routine: Most students come home in the afternoon, around 14:00, and log into the app. That’s when our CPU Credits begin to decrease. By 19:00, they’re gone, triggering the issue.
At first, we expected the load to be distributed evenly among all instances, so the fact that only one machine was failing threw us off. Until the mysterious failure gradually became consistent across the whole ten instances. So was it a random coincidence? The short answer is yes. It depends on when the instance started: We have 5–10 instances running in the daytime. In the evening, when no one is using our service anymore, five are removed until the following day. Beanstalk autoscaling takes care of restarting our machines automatically.
One of the frustrating discoveries was that AWS leaves a lot to be desired in terms of observability. We were disappointed to learn that AWS doesn’t notify you out of the box if you’ve used up all your credits.
As far as we can tell, it was random that this particular instance kept running longer than the others. It restarted around noon and gradually decreased in performance as some heavy database queries hit all instances, which eventually led to this problem. Shortly before we finally solved the mystery, it happened to several other machines.
The unraveling
We mentioned that the issue went away when we terminated the concerned instance. So our first solution was to upgrade the instance types. We reviewed the average CPU usage of our instances and applied the formula provided by AWS.
We eventually increased the instance size by four just to be future-proof. That’s still reasonably small, but we’re scaling horizontally, so it won’t be much of an issue if one instance fails.
We’re happy to say that the new instance created by the autoscaling no longer lags, nor do the other instances — our CPU Credits are steady.
Stay alert
An even more important step was to restructure our monitoring and alerting process, so we’ll be both aware and well-equipped to resolve any future mishaps.
Prometheus, our tool of choice, only monitors the data exposed in the instance itself, not what’s stored in CloudWatch. That’s why we didn’t know sooner.
We’re still using Prometheus, but we also import and merge the data from CloudWatch. Our current solution allows us to visualize the data on Grafana dashboards and set up rules via Alertmanager to ping us when something is wrong.
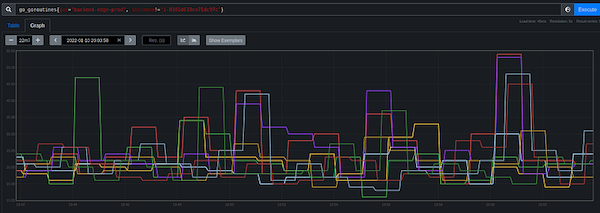
Goroutines on the other instances (2021–01–10)
One of the frustrating discoveries was that AWS leaves a lot to be desired in terms of observability. We probably should have set this up early, but we were disappointed to learn that AWS doesn’t notify you out of the box if you’ve used up all your credits.
Happy ending
Almost three months later, and with record traffic after Knowunity launched in France, we’re pretty satisfied with the performance. We have encountered no issues since we upgraded our instance type. We continue to monitor the CPU Credits, and it seems that we have found a suitable balance.
Our main takeaway is to focus on monitoring and observability, which are critical. We also learned that combining several metrics from multiple sources provides a complete picture of our system’s behavior and performance, allowing us to prevent problems proactively.
Epilogue
AWS EC2’s Burstable instances offer an incredible advantage for apps like Knowunity that experience traffic spikes during particular time frames. Here’s a typical scenario:
Traffic jumps between 9:40 and 10:00 when most schools in Germany have a longer break.
The next spike is after lunch — when school ends for lower grades.
Finally, at around 17:00, as older students log in, the system reaches peak traffic, which remains persistent until people log out at 22:00.
All 10 instances run during these peak times to ensure maximum capacity.
Many things can go wrong when you run out of CPU Credits — we’ve seen it happen to a few other portfolio companies. When you investigate what might have caused performance issues on AWS — the app, perhaps the database? — the key is often a fundamental piece: the hardware — the instance type.
How do you go about calculating and determining the right instance type?
As Amazon explains, “EC2 burstable performance instances provide a baseline level of CPU utilization” that can grow on demand. Both variables are controlled by CPU Credits that you earn or spend depending on the instance’s CPU usage. The formula is simple:
Each burstable instance continuously earns credits when it stays below the CPU baseline;
and spends credits when it bursts above the baseline.
In other words, you don’t buy CPU Credits — you gain them over time.
Before they optimized their setup, Knowunity‘s baseline was set at 10%, meaning they lost credit whenever the system used more than 10% of the CPU and gained credits whenever it used less.
However, their actual CPU usage was ~30%, so the problem went away once they adapted the baseline and set the correct instance type.
Have you ever experienced similar issues? What turned out to be the root cause? Which insights helped you future-proof your setup? We’d like to hear!